Building a plugin
Ultimately, a completed plugin will be a single .qplug file but there are two ways to get to that point. The .qplug file can be manually created and edited directly or there is the option of using the plugin compiler tool.
Manually Creating a Plugin
Manually creating a plugin is done by creating a text file and altering its extension to ,qplug. The necessary code is then inserted into the file using a favorite text editor such as Notepad++. Once the plugin is complete, open Designer. The plugin will automatically be loaded and as long as there are no errors, the plugin can then be dragged into the design and tested. To manually create a plugin....
-
Go to the "\QSC\Q-Sys Designer\Plugins" in "My Documents"
-
Create a blank text file
-
Give it a name and change it's extension to .qplug
-
Add the plugin info block, the design time functions and the run-time code
Using the Compiler
QSC has also developed a plugin compiler. It is a set of scripts designed to be used within Microsoft's VS Code platform. For more details on the features of the plugin compiler and how to use it, see the Plugin Compiler page.
Debugging Run-time Code
When creating a plugin, it can be difficult to debug the run-time code when it's already built into the plugin. There is a method to ease this debugging that works regardless if you use the manual method to create a plugin or the compiler.
Instead of putting the entire plugin together, create a separate "debug" plugin that includes everything except the run-time code. After adding a "code" pin control, the debug plugin can be added to a design along with a control script object. The control script object is used to hold the plugin's run-time code. By exposing the "code" pin of these two objects and connecting them together, the plugin file supplies the design-time aspects (and the UI part of the plugin) while the control script object provides the plugin's run-time code. The design can be emulated or run on a Core and the run-time code can then be debugged and edited live while using the plugin's own UI.
To debug run-time code:
-
Create a "debug" plugin file either manually or using the plugin compiler.
-
Provide it with a different UID and different name to differentiate it from the "final" plugin.
-
Add only the UI parts from the "final" plugin to it.
-
Add the following control to the GetControls() definition:
Copytable.insert(ctrls,{Name = "code",ControlType = "Text",UserPin = true,PinStyle = "Input",Count = 1}) -
Add the following to the GetControlLayout() section:
Copylayout["code"]={PrettyName="code",Style="None"} -
Leave the run-time part empty.
-
Save all the edits. If using the compiler, build the "debug" plugin.
-
Open a new design.
-
Drag in the newly created "debug" plugin and set its "Show Debug" property to "Yes".
-
Add a "Control Script" component and copy the run-time code into it.
-
Expose the "code" pins on both objects and connect them together. For example:
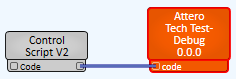
-
Emulate or push design to a Core.
Note: When debugging, ignore any errors in the debug window of the Control Script. Use the debug window of the plugin instead. Errors that indicate a particular line number will relate the line of code in the Control Script.
Once the code is fully complete and correct, go back to the "final" plugin, update the UI sections with any additional changes that may have been made, and add the script from the Control Script component to the run-time code section to create the full, "final" plugin.